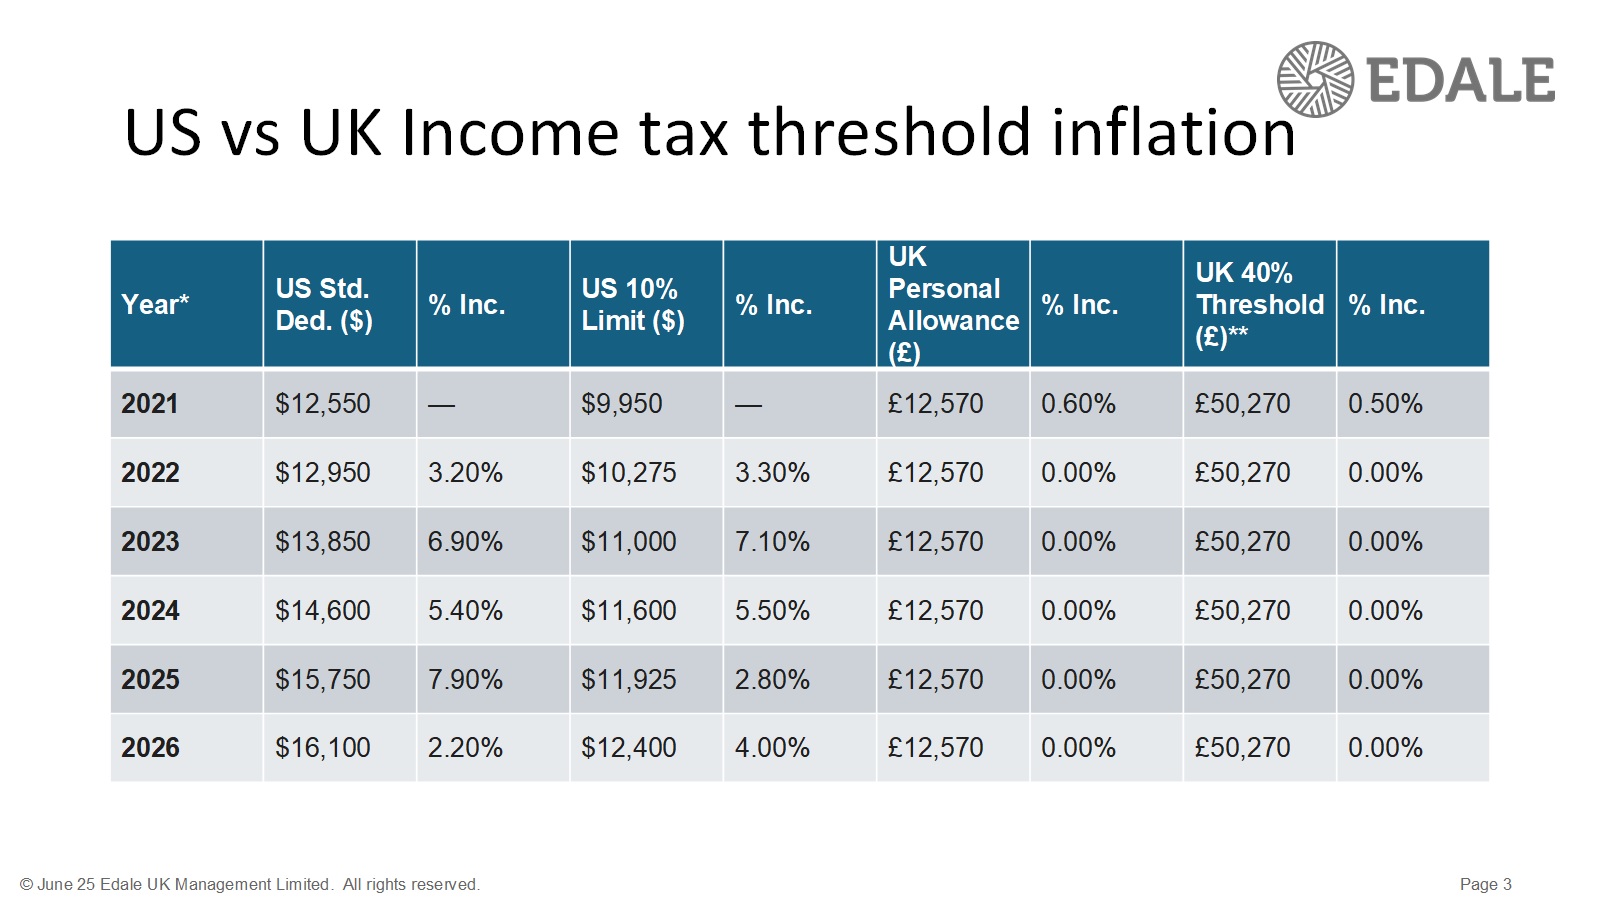
This image shows a comparison table of US and UK income tax thresholds from 2021 to 2026. It lists the US standard deduction and 10% bracket limit alongside their annual percentage increases, and sets these against the UK personal allowance and 40% tax threshold, which remain unchanged over the same period. The chart highlights how US thresholds move with inflation, while frozen UK bands pull more income into higher tax rates over time.